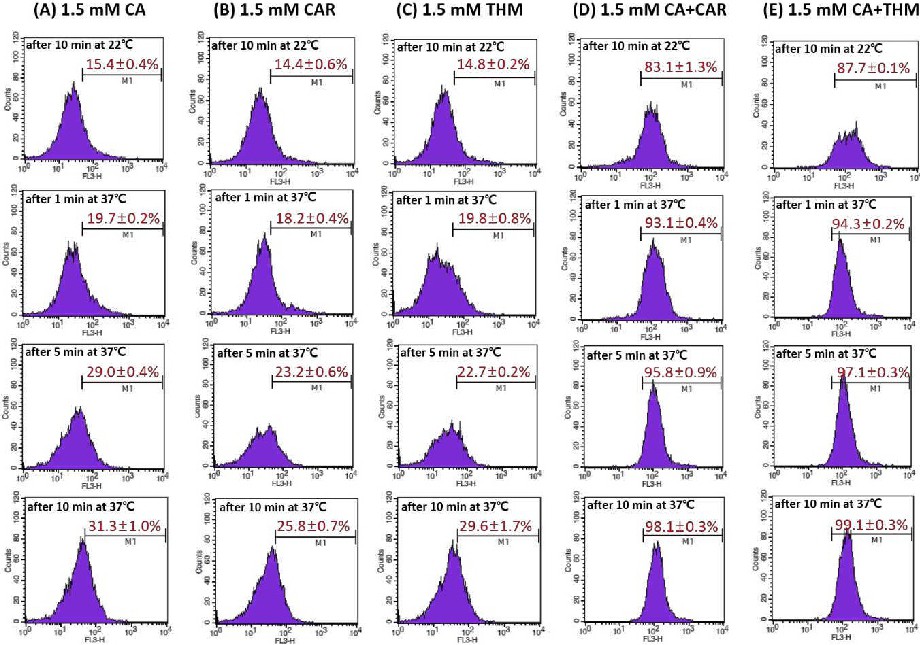
Fig. 4. Flow cytometry analysis with nile red staining showing the efflux pump activity of C. albicans cells treated with 1.5 mM CA alone (A), 1.5 mM CAR alone (B), 1.5 mM THM alone (C), 1.5 mM CA + 1.5 mM CAR (D), and 1.5 mM CA + 1.5 mM THM (E) for 10 min 22oC or for 1-10 min for 37oC. The percentage of cells in M1 shows the mean ± standard deviation (n = 3).